Reports
Net worth, income and expenses, spending by category, cash flow, a balance sheet and a trial balance, for any dates, by week, month, quarter or year.
Reports shows your money six ways for any dates you pick: what your accounts hold (Net worth and Balance sheet), what came in and went out (Income and expenses), where it went by category (Categories), how cash moved through your everyday accounts (Cash flow), and a check that the books add up (Trial balance). Each currency is reported on its own, and nothing on the page changes anything.
Open a report and pick the dates
- Open Reports in the sidebar. It starts on Net worth.
- Pick a report from the tabs along the top: Net worth, Income and expenses, Categories, Cash flow, Balance sheet or Trial balance.
- Set the dates with the Viewing bar. It starts on This month, and All time starts from the earliest date in your books.
- Under Options, choose a Group by and whether to Include archived accounts.
The dates, the grouping and the archived setting are all in the page address, so a bookmark or a link opens the same report, and switching tabs keeps them. Figures stop at today in your own timezone, whatever end date you pick. Finding your way around covers the date bar.
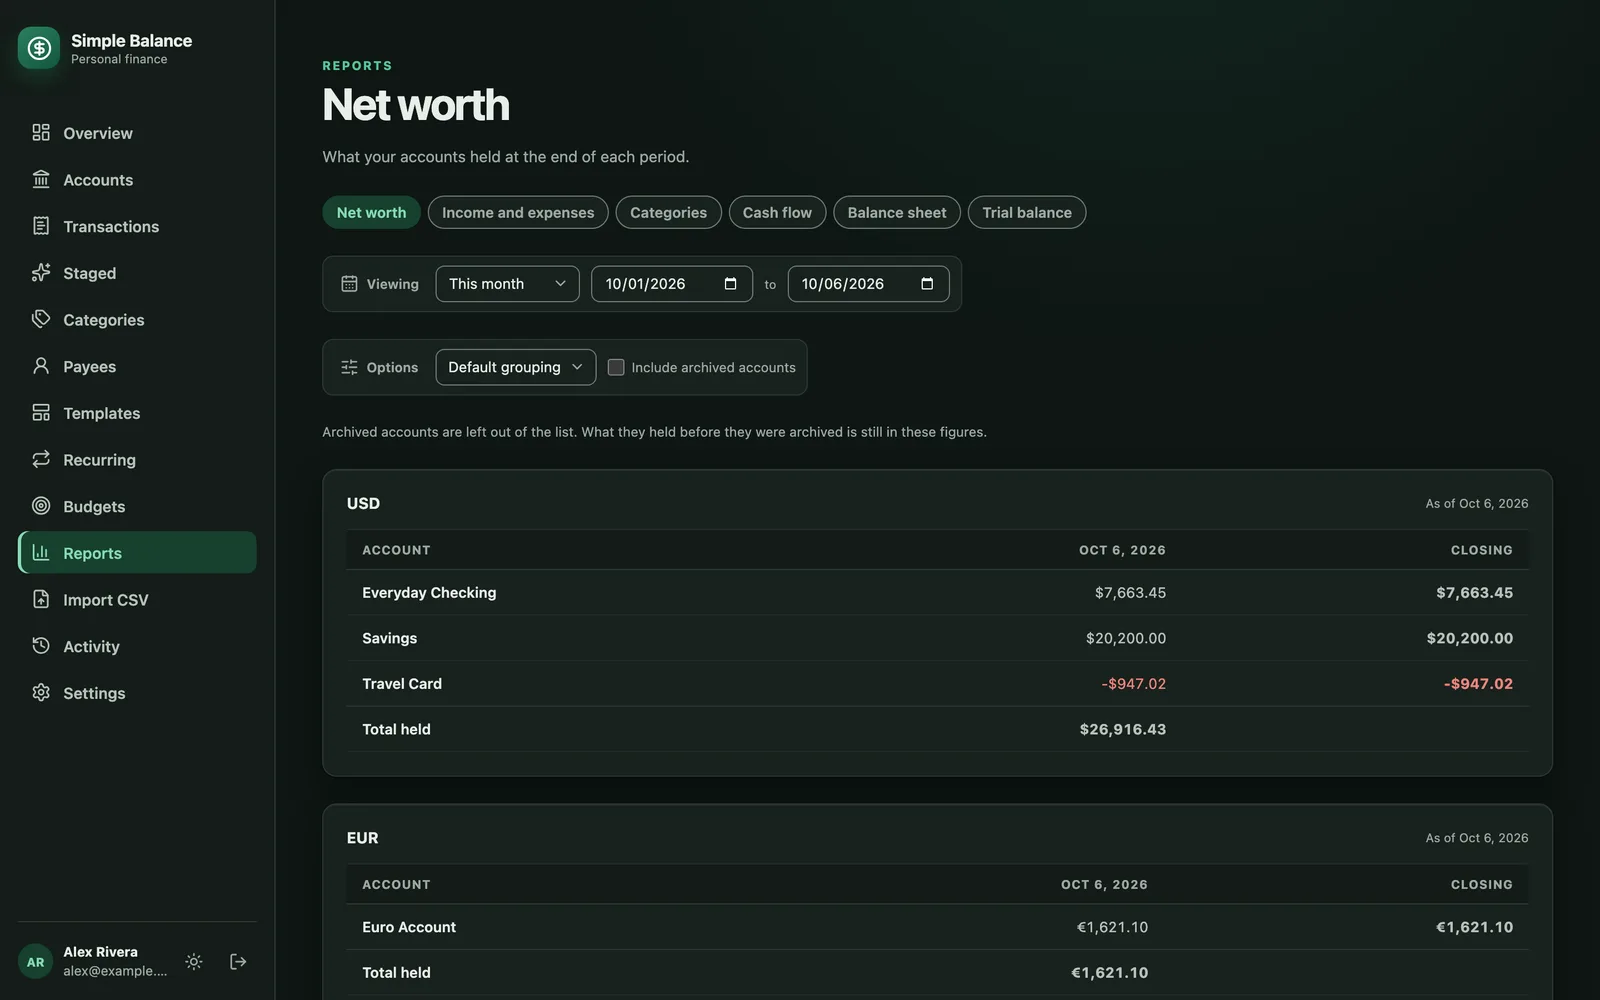
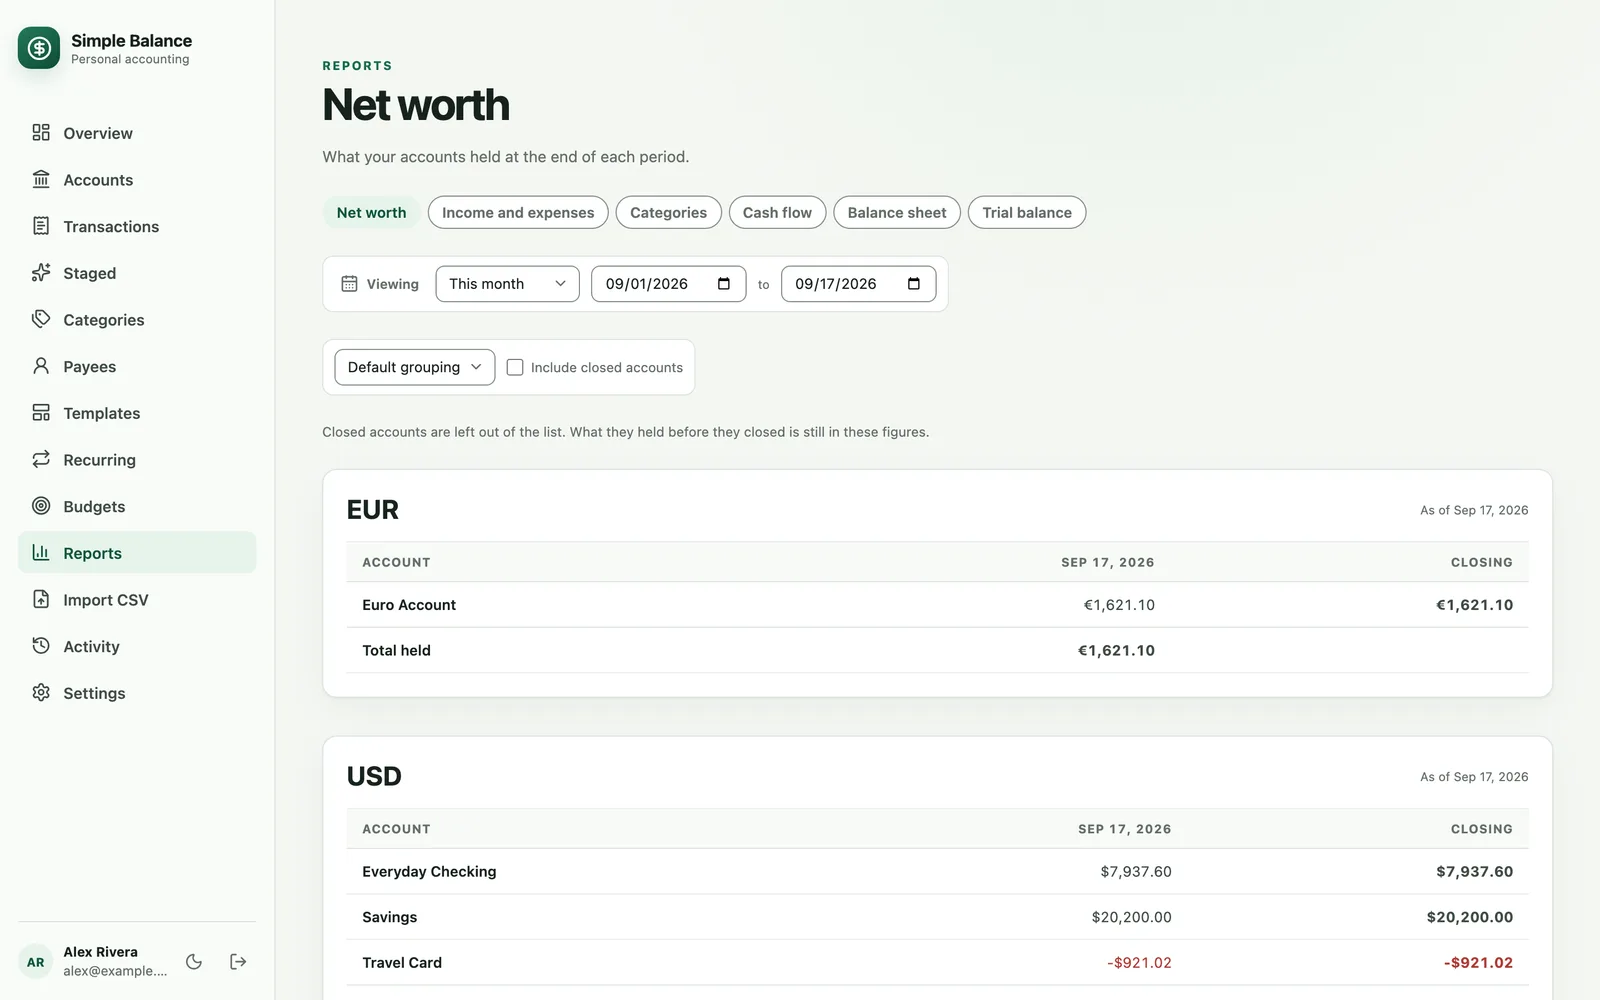
The money in this picture is made up. It’s the real product, filled with example spending.
The six reports
| Report | The question it answers | Rows | Grouped by default |
|---|---|---|---|
| Net worth | What did my accounts hold, period by period? | Each account, then Total held | Monthly |
| Income and expenses | Did more come in than went out? | Income, Expenses, then Net | Monthly |
| Categories | Where did the money go, and where from? | Each category, then Total filed | One column |
| Cash flow | How did cash move through my everyday accounts? | Up to seven kinds of movement, then Net | Monthly |
| Balance sheet | What does each account hold on one date? | Each account, then Total held | One column |
| Trial balance | Do the books add up? | Every account, then Total held | One column |
Net worth
“What your accounts held at the end of each period.” One row for each account, in alphabetical order, and Total held at the bottom: what you own minus what you owe. Credit cards and loans count as negative. The last column, Closing, is what each account held at the end of your dates. With more than one column, a line chart is drawn above the table. What is net worth? explains why it’s worth watching.
Income and expenses
“What came in and what went out over each period.” Two rows, Income and Expenses, with expenses shown as negative, and Net at the bottom: what you kept, or how much you overspent. The Total column adds up the periods. A refund lowers Expenses, and a transfer between your own accounts is in neither row. Grouped by month, it’s drawn as bars.
Categories
“Where the money went and where it came from, by what you filed it under.” One row for each category with money in your dates, spending and income categories alike. Spending and income both count as positive amounts here, and a refund lowers its category’s figure. The biggest is first and Uncategorized is last.
- A category used both ways, such as one set to Income or expense, shows as two rows, like “Side work (income)” and “Side work (expense)”. Uncategorized can show twice the same way.
- Total filed adds up every row on screen, income and spending together, so it isn’t what you kept. Income and expenses answers that.
- It’s one column by default. Group it by month to see each category over time, drawn as bars.
- This is the only report where you can leave a category out of the view.
Cash flow
“Movements in and out of the accounts you can spend from, by where the money came from and went to.” It counts only Checking, Savings and Cash accounts, and sorts each movement by the account on the other side of it:
| Row | What lands in it |
|---|---|
| Earning and spending | Pay, purchases, bills and refunds: money that came in as income or went out as spending. |
| Investing | Money to or from investment, crypto and other asset accounts. |
| Borrowing and repaying | Money to or from credit cards, loans and other debts, such as paying a card bill. |
| Between your own accounts | Transfers between two of your checking, savings and cash accounts. |
| Currency exchange | The other side of moving money between two currencies. |
| Opening balances | The starting balances of these accounts. |
| Other | Anything that fits none of the rows above. |
Money coming in is positive and money going out is negative, and Net is how much these accounts went up or down. Archiving an account isn’t counted as money moving.
The page says why this won’t match Income and expenses: “Cash flow will not match income and expenses, and the gap is widest if you use a credit card. A card purchase is an expense the day you make it; the cash leaves when you pay the bill, in a different period and under borrowing and repaying. Both figures are right.” How to budget with a credit card goes into that gap.
Balance sheet
“What every account holds, as of one date.” The same accounts as Net worth, in one column headed with the date it’s as of: the end of your dates, or today if that’s earlier. Group it by month or year to see it over time.
Trial balance
“Every account including the ledger’s own counter-accounts. It totals zero when the books are whole.” Every entry in Simple Balance is recorded on two sides, and this report lists both: your accounts, plus the accounts on the other side of your entries, which are Income, Expenses, Opening Balances and Currency Exchange. Each currency has its own set, and each of these appears once something uses it.
Total held at the bottom should be zero. Archived accounts are always listed here, whatever the checkbox says. How deposits, withdrawals and transfers work explains the two sides. On your own copy, it’s also the check Backups uses after a restore.
Group by and charts
Group by, under Options, decides the columns:
- Default grouping: each report’s own, from the table above.
- One column: the whole date range at once.
- Weekly, Monthly, Quarterly or Yearly: one column per period. Weeks start on Monday.
With more than one column, a chart appears above the table: a line for Net worth, Balance sheet and Trial balance, and bars for the other three. Each column is headed by its first day, and the first and last columns are cut to your dates, so a range starting on the 16th starts its first column on the 16th. With one column, the heading is the date a balance is as of, or the start and end dates for the other reports.
The last column is Closing on the three balance reports, which is what each account held at the end, and Total on the others, which adds up the columns.
A report can draw at most 600 columns. Weekly over twelve years is too many, and the page says “That range needs more than 600 week columns, which is the most a report will draw. Ask for a coarser bucket or a shorter range.” Pick a longer grouping or shorter dates.
Archived accounts
Include archived accounts starts off, and it means something different on each kind of report. The page says which under the options.
- Net worth and Balance sheet: off, an archived account that held nothing during your dates isn’t listed, but what it held before it was archived is still in the figures. On, every archived account is listed. Either way, an archived account has “(archived)” after its name.
- Trial balance: every account is always listed.
- Income and expenses, Categories and Cash flow: off, what was earned and spent through archived accounts is left out. On, it’s counted.
Budgets work the other way: they count spending through archived accounts unless you turn it off. Budgets says why.
More than one currency
Each currency gets its own panel, headed with its code, like USD, and “As of” the last day counted. Your default currency comes first. Nothing is ever added across currencies, because there are no exchange rates to add them with. More than one currency covers the rest.
Leave a category out of the view
One huge category, like rent or a tax bill, can flatten every other bar on the chart. On Categories, you can set it aside for a moment:
- Press the ⋯ button on the category’s row.
- Choose Exclude from this view.
The row and its part of the chart go, and the totals are worked out again from the rows still on screen. A line above the report says “Left out of this view:” and names each one. Press a name to put it back, or Put all back for all of them.
This changes nothing stored. Switching to another report or leaving the page forgets it, and an AI assistant you’ve connected still sees every category.
From a figure to what’s behind it
- An account’s name, on Net worth and Balance sheet, opens that account’s page for the same dates. Show register there lists every entry with the balance before and after it, which is where to look when a balance is wrong. Accounts has more.
- A category’s name, on Categories, opens that category’s page for the same dates. Uncategorized doesn’t link anywhere: find those on Transactions.
- What changed and when is on Activity. Activity history covers it.
When a report is empty
With nothing to show for your dates, the page says Nothing in this view to report and suggests turning on Include archived accounts, in case the money went through an account you’ve archived. With that box on, it says Nothing to report yet instead. Either way it offers Add a transaction. Dates that start after today show nothing, because that money hasn’t moved yet.